Here is how to limit size of /var/log/pods on K3s. Create /etc/rancher/k3s/config.yaml or if existent add the following arguments kubelet arguments:
kubelet-arg:
- "container-log-max-files=2"
- "container-log-max-size=2Mi"
This will cause k3s to create 2 log files, each with maximum size of 2M.
Alternatively the arguments can be passed to k3s binary itself.
k3s server --kubelet-arg container-log-max-files=4 --kubelet-arg container-log-max-size=50Mi
[root@k3sm01 ~]# kubectl get apiservices
v1.k3s.cattle.io Local True 15m
v1beta1.metrics.k8s.io kube-system/metrics-server False (MissingEndpoints) 15m
v1.crd.projectcalico.org Local True 6m32s
I found a potential solution which unfortunately, did not help. Nevertheless, I needed to try to modify metrics-server deployment. Specifically, I needed to add –kubelet-insecure-tls option. Turns out this can be done using kubectl patch command:
[root@k3sm01 ~]# kubectl patch deployment metrics-server -n kube-system --type='json' -p='[{"op": "add", "path": "/spec/template/spec/containers/0/args/-", "value": "--kubelet-insecure-tls"}]'`
The path parameter is derived from components.yaml of metrics-server.
One can always do a re-deployment after editing the appropriate file.
]]>Mar 17 07:58:23 prx013 NetworkManager[1154]: <warn> [1679036303.3521] platform-linux: do-add-ip6-address[2: fe80::250:56ff:feb9:dc71]: failure 95 (Operation not supported)
Mar 17 07:58:25 prx013 NetworkManager[1154]: <warn> [1679036305.3543] ipv6ll[40b05df140eccb36,ifindex=2]: changed: no IPv6 link local address to retry after Duplicate Address Detection failures (back off)
Oh yes, NetworkManager! Thankfully, the following stops the madness:
[root@prx013 ~]# nmcli device modify ens224 ipv6.method "disabled"
[root@prx013 ~]#
Needless to say NetworkManager is not my most favorite tool.
]]>[root@build01 ~]# dmesg | grep overflow
[ 0.289646] audit: kauditd hold queue overflow
[ 0.364107] audit: kauditd hold queue overflow
Apparently, there is a backlog limit for audit messages. This limit specifies queue size for unprocessed events intended for auditd. In this particular case, the limit was too low. This can be fixed by turning off auditd. But then, there is most likely a reason, why the daemon is on in the first place. Alternatively, the backlog queue limit can be increased.
To do so, in /etc/default/grub edit line starting with GRUB_CMDLINE_LINUX…:
...
GRUB_DISABLE_SUBMENU=true
GRUB_TERMINAL_OUTPUT="console"
GRUB_CMDLINE_LINUX="audit=1 audit_backlog_limit=8192 ipv6.disable=1 crashkernel=auto resume=/dev/mapper/system-swap rd.lvm.lv=system/root rd.lvm.lv=system/swap rhgb quiet"
GRUB_DISABLE_RECOVERY="true"
...
… and add audit_backlog_limit=8192, thus forcing the new hold queue size. After that GRUB configuration needs to be rebuilt:
[root@build01 ~]# grub2-mkconfig -o /boot/grub2/grub.cfg
[root@build01 ~]#
That should do it.
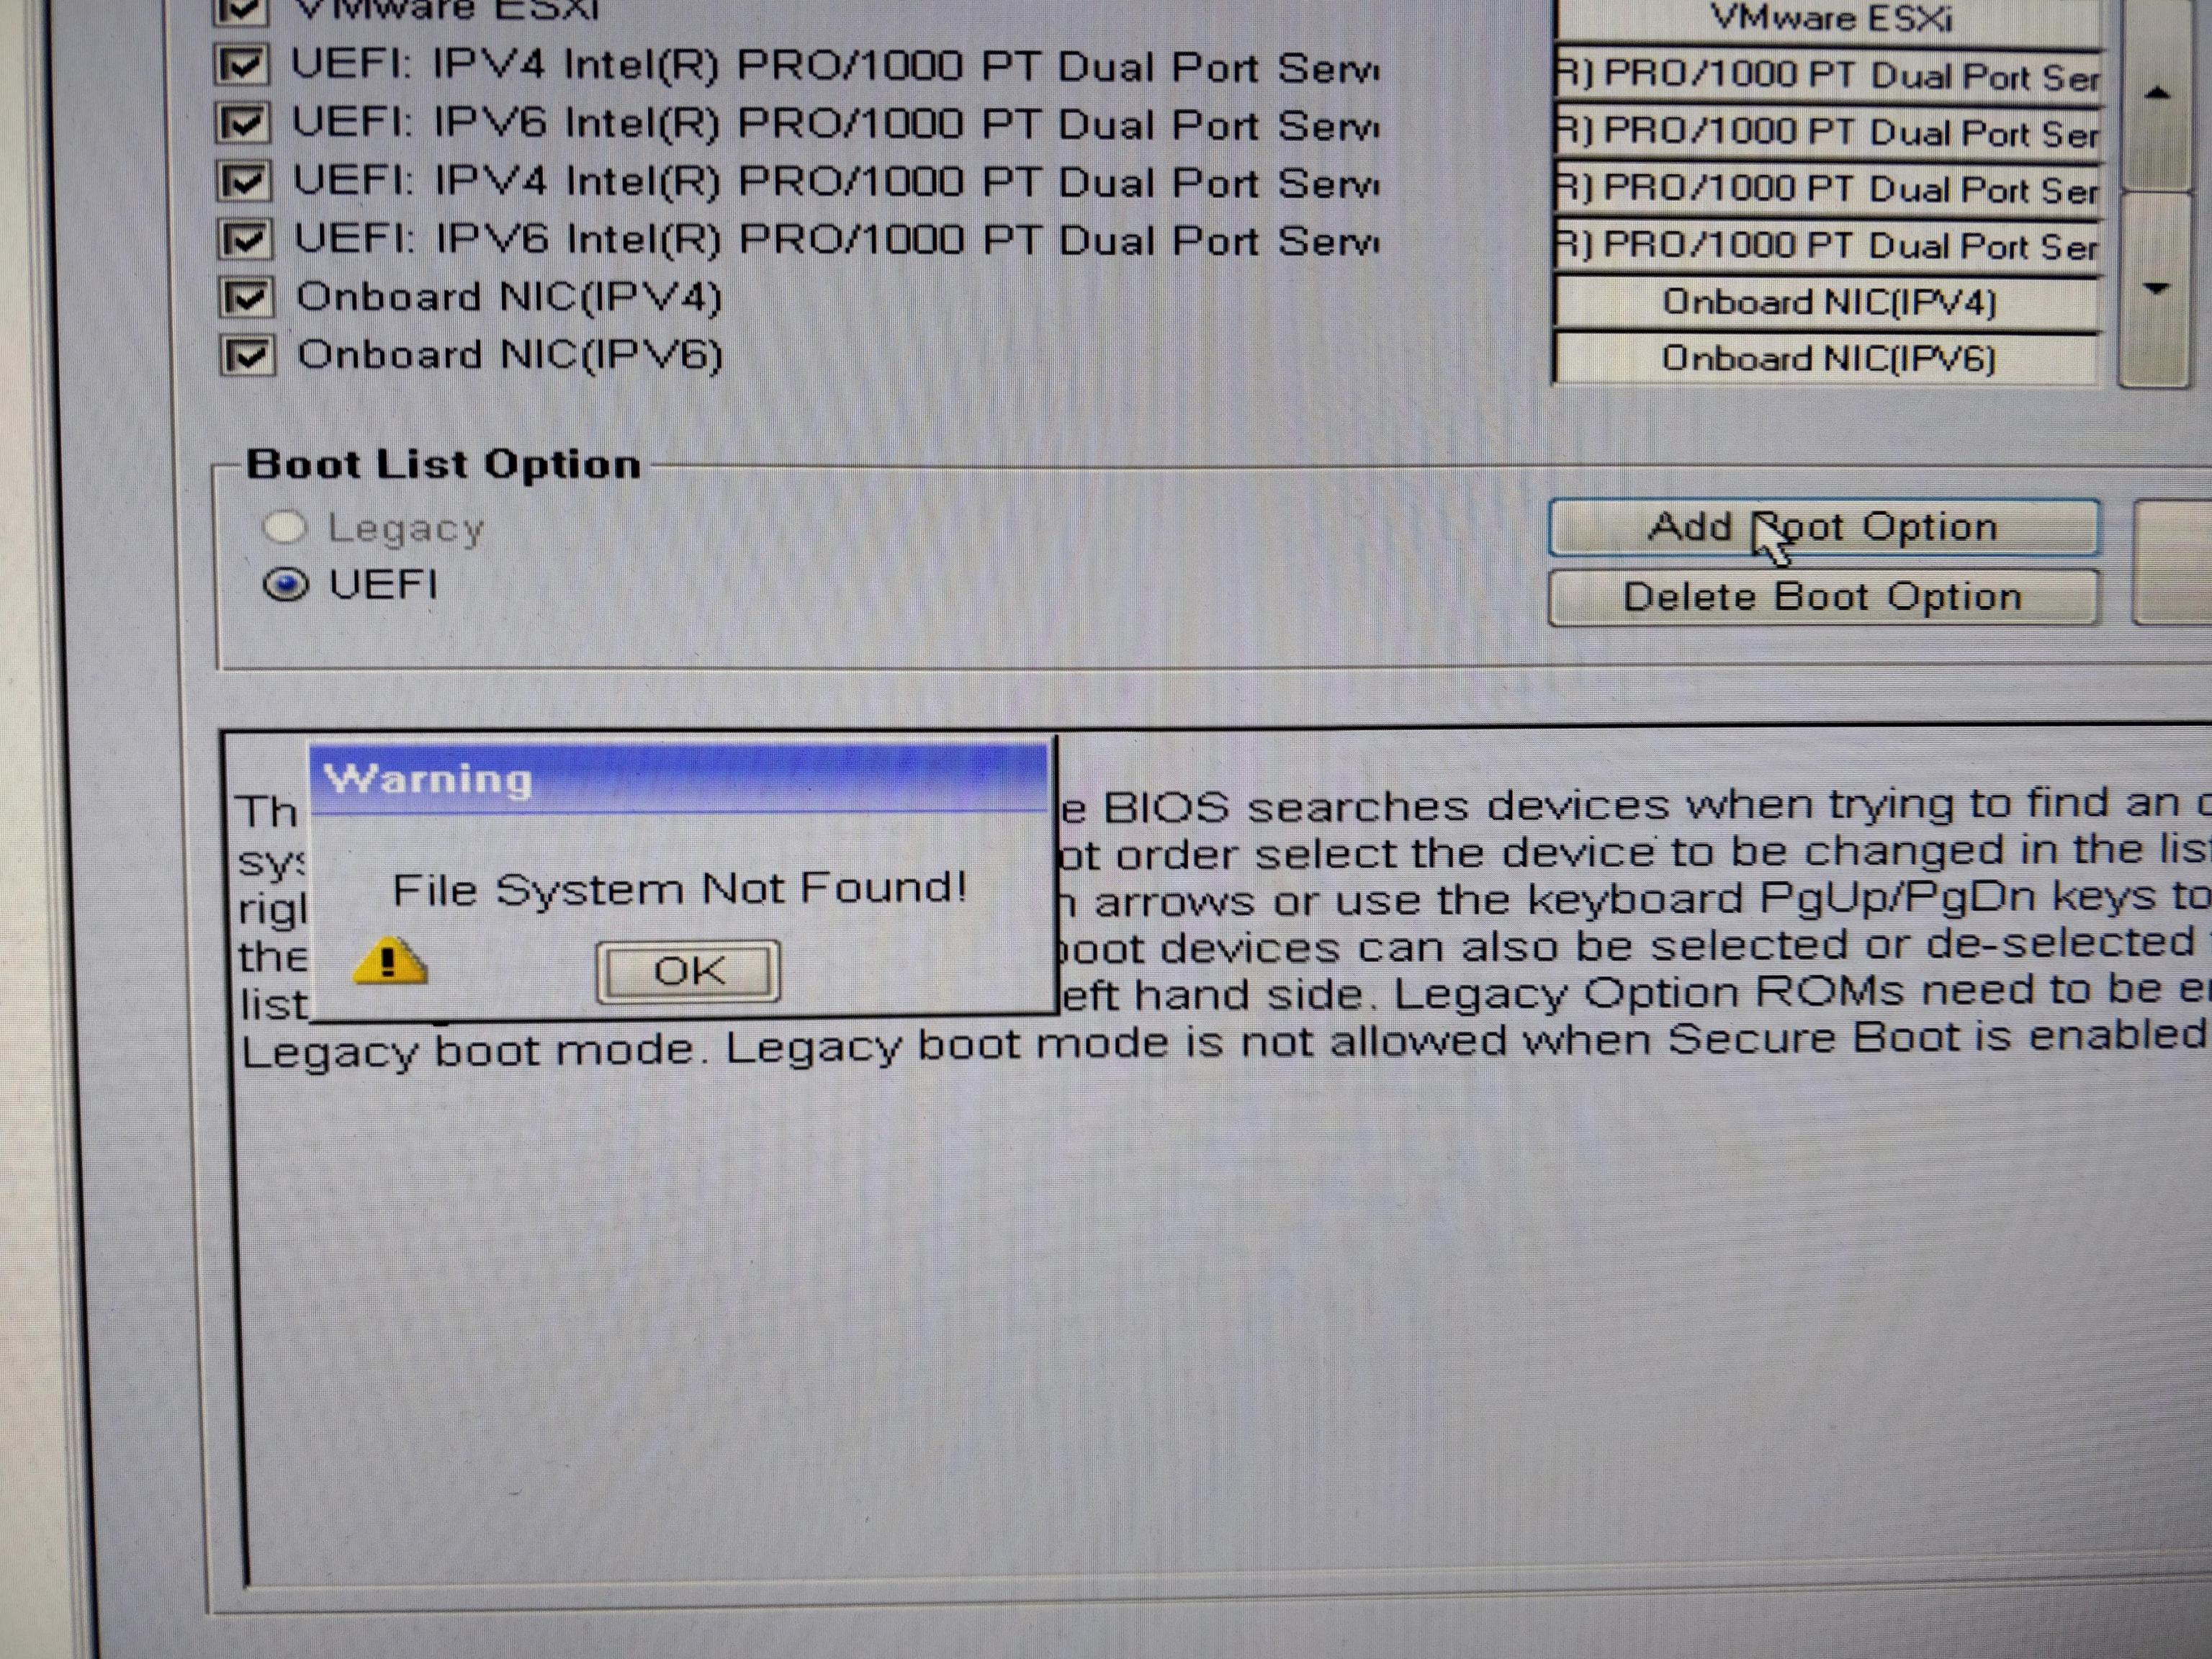
]]>Now the details. After performing vSphere installation and booting the system, the UEFI boot menu would contain “VMware ESXi” entry. Selecting the entry would result in no response. VMware has an article suggesting a possible solution, which did not work in my case. All attempts to manually add a new boot entry in BIOS resulted in “File system not found” error.
So, I thought maybe filesystem on EFI partition is not clean. I booted the machine using USB stick and ran fsck on the partition:
root@mint:~# fsck /dev/sda1
fsck from util-linux 2.31.1
fsck.fat 4.1 (2017-01-24)
/dev/sda1: 11 files, 348/51091 clusters
root@mint:~#
Filesystem was clean, yet the machine failed to boot. After some searching I found a similar problem. Again, I tried the filesystem check, this time using FreeBSD:
# fsck_msdosfs /dev/da0s1
** /dev/da0s1
** Phase 1 - Read FAT and checking connectivity
** Phase 2 - Checking Directories
** Phase 3 - Checking for Lost Files
Next free cluster in FSInfo block (2) not free
Fix? [yn] y
4 files. 31MiB free (63781 clusters)
#
It seemed the filesystem check fixed an issue. Still the machine would not boot. The only thing I had not tried at this point was to recreate FAT filesystem on vSphere EFI partition…
root@mint:~# mount /dev/sda1 /tmp/EFIMNT/
root@mint:~# cp -r /tmp/EFIMNT/* /tmp/EFIBKP/
root@mint:~# umount /dev/sda1
root@mint:~# file -s /dev/sda1
/dev/sda1: DOS/MBR boot sector, code offset 0x58+2, OEM-ID "MSDOS5.0", sectors/cluster 4, reserved sectors 2, root entries 512, Media descriptor 0xf8, sectors/FAT 200, sectors/track 32, heads 64, sectors 204800 (volumes > 32 MB), serial number 0x558938bd, label: "BOOT ", FAT (16 bit)
root@mint:~# mkfs -t vfat -n BOOT /dev/sda1
mkfs.fat 4.1 (2017-01-24)
root@mint:~#
…then check the new filesystem and put back the original boot files:
root@mint:~# file -s /dev/sda1
/dev/sda1: DOS/MBR boot sector, code offset 0x3c+2, OEM-ID "mkfs.fat", sectors/cluster 4, reserved sectors 4, root entries 512, Media descriptor 0xf8, sectors/FAT 200, sectors/track 32, heads 64, hidden sectors 64, sectors 204800 (volumes > 32 MB), serial number 0x31d4d250, label: "BOOT ", FAT (16 bit)
root@mint:~# mount /dev/sda1 /tmp/EFIMNT/
root@mint:~# cp -r /tmp/EFIBKP/* /tmp/EFIMNT/
root@mint:~# umount /dev/sda1
Finally, the machine booted. I retried the whole process a few times. Above was the only time when FreeBSD fsck returned with unclean filesystem. So, I am not entirely sure, if vSphere 8 has some thing going on, or if it is the fact that my Dell Optiplex is so old. Nevertheless vSphere 8 was successfully installed.
]]>Error loading /vsan.v00
"Fatal error: 10 (Out of resources)"
Quick Google search revealed nothing useful, really. This article from VMware might be helpful to some. Unfortunately Optiplex has no such setting. In the end switching from “Legacy boot” to “UEFI” resolved the issue.
This other post might be worth checking out as well.
]]>First you need to enable workload identity on your kubernetes cluster:
After that, you need to create kubernetes namespace and kubernetes service account called ksa-sql-workload:
[somedude@k2 ~]$ kubectl create namespace myknamespace
[somedude@k2 ~]$ kubectl create serviceaccount ksa-sql-workload --namespace myknamespace
Following that, create GCP service account gsa-sql-workload.
[somedude@k2 ~]$ gcloud iam service-accounts create gsa-sql-workload --project=somedudegproject
Add role to GCP service account. 123456789012 is the project ID of you GCP project. Here, gsa-sql-workload service account is assigned cloudsql.client role:
[somedude@k2 ~]$ gcloud projects add-iam-policy-binding 123456789012 --member "serviceAccount:gsa-sql-workload@@somedudegproject.iam.gserviceaccount.com" --role "roles/cloudsql.client"
Next, you bind GCP service account with kubernetes service account, so that kubernetes service account gets privileges of GCP service account. Sheesh…
[somedude@k2 ~]$ gcloud iam service-accounts add-iam-policy-binding --role "roles/iam.workloadIdentityUser" --member "serviceAccount:somedudegproject.svc.id.goog[myknamespace/ksa-sql-workload]" gsa-sql-workload@somedudegproject.iam.gserviceaccount.com
Updated IAM policy for serviceAccount [gsa-sql-workload@somedudegproject.iam.gserviceaccount.com].
bindings:
- members:
- serviceAccount:somedudegproject.svc.id.goog[myknamespace/ksa-sql-workload]
role: roles/iam.workloadIdentityUser
etag: A1234567890=
version: 1
Finally, annotate the service account:
[somedude@k2 ~]$ kubectl annotate serviceaccount ksa-sql-workload --namespace myknamespace iam.gke.io/gcp-service-account=gsa-sql-workload@somedudegproject.iam.gserviceaccount.com
serviceaccount/ksa-sql-workload annotated
If you enabled workload identity on cluster node pool, you can use nodeSelector in deployment to make sure your containers land on workload identity enabled nodes.
template:
metadata:
labels:
app: ...
spec:
...
affinity:
...
tolerations:
...
...
serviceAccountName:
ksa-sql-workload
nodeSelector:
iam.gke.io/gke-metadata-server-enabled: "true"
containers:
Start by configuring trunking on vCenter port group: Depending on what you need you can trunk all VLAN’s towards the VM (not wise) or you can trunk just specific VLAN ranges:
You might need to set the policies as follows:
Next, reconfigure the NIC on the Rocky VM to work as a trunk:
[root@docker01 network-scripts]# more ifcfg-ens224
NAME=ens224
DEVICE=ens224
ONBOOT=yes
NETBOOT="yes"
TYPE=Ethernet
Then, configure VLAN 50 interface for management…
[root@docker01 network-scripts]# cat ifcfg-ens224.50
VLAN=yes
TYPE=Vlan
PHYSDEV=ens224
VLAN_ID=50
REORDER_HDR=yes
GVRP=no
MVRP=no
HWADDR=
IPADDR=192.168.50.10
NETMASK=255.255.255.0
GATEWAY=192.168.50.254
DNS1=192.168.50.100
PROXY_METHOD=none
BROWSER_ONLY=no
BOOTPROTO=none
DEFROUTE=yes
IPV4_FAILURE_FATAL=no
IPV6INIT=yes
IPV6_AUTOCONF=yes
IPV6_DEFROUTE=yes
IPV6_FAILURE_FATAL=no
IPV6_ADDR_GEN_MODE=stable-privacy
NAME=ens224.50
UUID=bdfdd998-7359-4b5f-8ae7-7e3b7786bb22
DEVICE=ens224.50
ONBOOT=yes
PREFIX=24
RES_OPTIONS="rotate timeout:1 retries:1"
…and VALN701 interface:
[root@docker01 network-scripts]# cat ifcfg-ens224.701
VLAN=yes
TYPE=Vlan
PHYSDEV=ens224
VLAN_ID=701
REORDER_HDR=yes
GVRP=no
MVRP=no
IPADDR=192.168.70.29
NETMASK=255.255.255.240
GATEWAY=192.168.70.30
DNS1=192.168.70.1
PROXY_METHOD=none
BROWSER_ONLY=no
BOOTPROTO=none
DEFROUTE=no
IPV4_FAILURE_FATAL=no
IPV6INIT=no
IPV6_AUTOCONF=no
IPV6_DEFROUTE=no
IPV6_FAILURE_FATAL=no
IPV6_ADDR_GEN_MODE=stable-privacy
NAME=ens224.701
UUID=0809f5a6-1b2a-4a37-b664-fa9c46634c92
DEVICE=ens224.701
ONBOOT=yes
PREFIX=28
RES_OPTIONS="rotate timeout:1 retries:1"
The same configuration should be performed for VLAN 60 interface adjusting settings as needed.
At this point there should be three functioning interfaces, ens224.50, ens224.60 and ens224.701. Next, you need to configure symmetric routing. Rather than taking a stab at explanation, here is a pretty good one instead.
So, in my case the following rule-* and route-* files are needed for VLAN 50 and VLAN 701. You need to perform similar configuration for any other VLAN’s you will need.
The following is routing for VLAN 50. Note the default entry; this is the management interface:
[root@docker01 network-scripts]# cat route-ens224.50
192.168.50.0/24 dev ens224.50 src 192.168.50.10 table rt50
default via 192.168.50.254 table rt50
Next, I specify rule under which the above routes will be utilized:
[root@docker01 network-scripts]# cat rule-ens224.50
from 192.168.50.10 prio 50 table rt50
Similarly the following files deal with VLAN701. Note the absence of default entry:
[root@docker01 network-scripts]# cat rule-ens224.701
from 192.168.70.29 prio 70 table rt701
[root@docker01 network-scripts]# cat route-ens224.701
192.168.70.16/28 dev ens224.701 src 192.168.70.29 table rt701
Now, I need to make sure the alternate routing tables are defined in rt_tables. This is simply a mapping file that say “a number maps to this friendly name”.
[root@docker01 network-scripts]# cat /etc/iproute2/rt_tables
#
# reserved values
#
255 local
254 main
253 default
0 unspec
#
# local
#
#1 inr.ruhep
50 rt50
60 rt60
70 rt701
There are more details on the content of two files here.
Like me, you might need to install NetworkManager-dispatcher-routing-rules package that will allow NetworkManager process the route-* and rule-* files.
Finally, below is a snippet from docker-compose.yml. Note IP address assignment for interface VLAN 701 and its definition towards the bottom utilizing macvlan driver.
version: "3"
services:
nginx:
container_name: nginx
image: nginx:mainline-alpine
restart: always
ports:
- 80:80
networks:
db:
vlan701:
ipv4_address: 192.168.70.28
...
networks:
vlan701:
name: VLAN701 dmz-app to expose external apps
driver: macvlan
driver_opts:
parent: ens224.701
ipam:
config:
- subnet: 192.168.70.16/28
gateway: 192.168.70.30
Depending on the environment you might need to fiddle with rp_filter, see more info below:
]]>The file descriptors are automatically numbered 0, 1 and 2: as in stdin, stdout and stderr. stdin accepts input. The input can be from the terminal or an output from another program. stdout “produces” output from the command. This can be echoed back to the display screen or used as input stream for another program. stderr is meant for errors emitted from the program. Those, of course are predefined uses. There is nothing stopping you from using stderr as stdout.
[admin@build01 ~]$ ps -ef | grep bash
admin 2527817 2527816 0 23:34 pts/0 00:00:00 -bash
[admin@build01 ~]$ cd /proc/2527817/fd
[admin@build01 fd]$ ls -l
total 0
lrwx------. 1 admin admin 64 Nov 30 23:42 0 -> /dev/pts/0
lrwx------. 1 admin admin 64 Nov 30 23:42 1 -> /dev/pts/0
lrwx------. 1 admin admin 64 Nov 30 23:42 2 -> /dev/pts/0
lrwx------. 1 admin admin 64 Nov 30 23:42 255 -> /dev/pts/0
lr-x------. 1 admin admin 64 Nov 30 23:42 3 -> /var/lib/sss/mc/passwd
You might notice file descriptors 3 and 255. Here and here is more info on what those are.
Let’s cat a file:
[admin@build01 ~]$ cat file.txt
This is a text file.
The file is displayed via stdout. We can supply file.txt as input to cat command and redirect output to newfile.txt:
[admin@build01 ~]$ cat < file.txt > newfile.txt
[admin@build01 ~]$ cat newfile.txt
This is a text file.
Let’s say there is nonexistent file nofile.txt:
[admin@build01 ~]$ cat nofile.txt
-bash: nofile.txt: No such file or directory
The error was displayed via stderr. Let’s assume we want to capture the errors in a separate file:
[admin@build01 ~]$ cat nofile.txt 2> error.txt
[admin@build01 ~]$ cat error.txt
cat: nofile.txt: No such file or directory
2 means to redirect stderr to error.txt. To redirect stdout of a command one would do something like: somecommand > output.txt. That is the same as:
[admin@build01 ~]$ cat file.txt 1> redirect.txt
[admin@build01 ~]$ cat redirect.txt
This is a text file.
Notice the 1. Sometimes you do not want to see error messages showing on the screen so we can redirect stderr to /dev/null:
[admin@build01 ~]$ cat nofile.txt 2> /dev/null
[admin@build01 ~]$
The following is sometimes used in cron jobs. A script is run, that has some output going to stdout but in between, you might have some messages emitted to stderr. You might not want to be notified by cron about the outputs, so you can redirect stderr to stdout to /dev/null:
[admin@build01 ~]$ cat nofile.txt > /dev/null 2>&1
[admin@build01 ~]$
2>&1 means redirect stderr to stdout. So, for example if you had 3>&2, that would mean to redirect file descriptor 3 to stderr. If you omited & then the redirect would go to file called 2. & sign can be thought of as “file descriptor”.
Advanced Bash-Scripting Guide has some good info, too.
]]>By the way when I was figuring this out I came across this page. The person was doing exactly the same, so that made my life quite easy. I did end up stealing his HAproxy check command - credit goes out to that person.
Make sure HAproxy version used is 1.8 or higher. Versions prior to 1.8 lack external-check, used to determine current PostgreSQL master. CentOS 7 has quite an old version of HAproxy included.
On the master server create a PostgreSQL user - haproxy to be used by HAproxy for monitoring. This user will be propagated to the replica.
# su - postgres
-bash-4.2$ psql
psql (13.3)
Type "help" for help.
postgres=# CREATE USER haproxy WITH PASSWORD 'haproxy';
CREATE ROLE
postgres=# quit
-bash-4.2$
On both, master and replica server, edit pg_hba.conf and add entry for PostgreSQL haproxy user that will be connecting from HAproxy server to and allow it to access postgres database. The IP address is the address of HAproxy server.
host postgres haproxy 192.168.100.100/32 scram-sha-256
Do not forget to restart PostgreSQL. To configure HAproxy add the following parameters to haproxy.cfg:
global
# The following are needed to use external-check command in backend section below
insecure-fork-wanted
external-check
backend pgsql
mode tcp
external-check command /var/lib/haproxy/checkpg.sh
option external-check
server masterdb.unixpowered.com 10.10.10.10:5432 check inter 1s
server replicadb.unixpowered.com 10.10.10.20:5432 check inter 1s
Above, checkpg.sh script is what figures out which PostgreSQL server is primary. The script looks at pg_is_in_recovery(). If true is returned then the server is in recovery, i.e. standby. Based on this value HAproxy can determine where to send database traffic.
#!/bin/bash
# These are variables that facilitate connection of PostgreSQL to check pg_is_in_recovery()
#
_PG_USER=haproxy
_PG_PASS=haproxy
_PG_DB=postgres
_PG_BIN=/usr/pgsql-13/bin/psql
#
# These are HAproxy virtual IP,port and real IP. These are passed as parameters to the check script.
# See https://web.archive.org/web/20211012185217/https://www.loadbalancer.org/blog/how-to-write-an-external-custom-healthcheck-for-haproxy/
_VIRT_IP=$1
_VIRT_PORT=$2
_REAL_IP=$3
if [ "$4" == "" ]; then
_REAL_PORT=$_VIRT_PORT
else
_REAL_PORT=$4
fi
STATUS=$(PGPASSWORD="$_PG_PASS" $_PG_BIN -qtAX -c "select pg_is_in_recovery()" -h "$_REAL_IP" -p "$_REAL_PORT" --dbname="$
_PG_DB" --username="$_PG_USER")
if [ "$STATUS" == "f" ]; then
# We are in master mode
exit 0
else
exit 1
fi